# 4.6.3 Add Contents to a Report
Click the just-created report name. You will be taken to the next page. From here, you can add content to the report.
### Process:
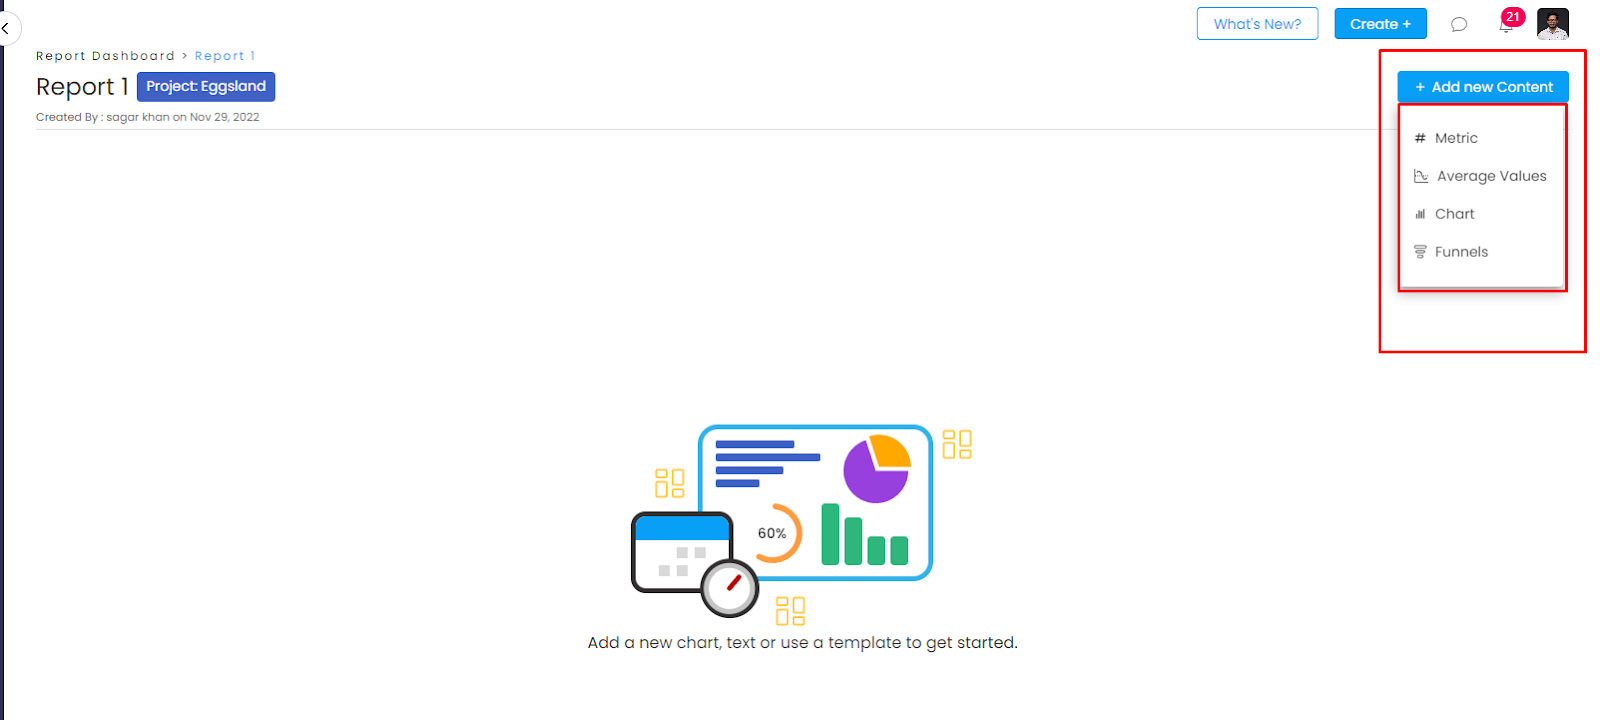
1. Click the “+ Add new content” button.
2. You will see some options for your report format. Choose your content. A preview of that content will be shown.
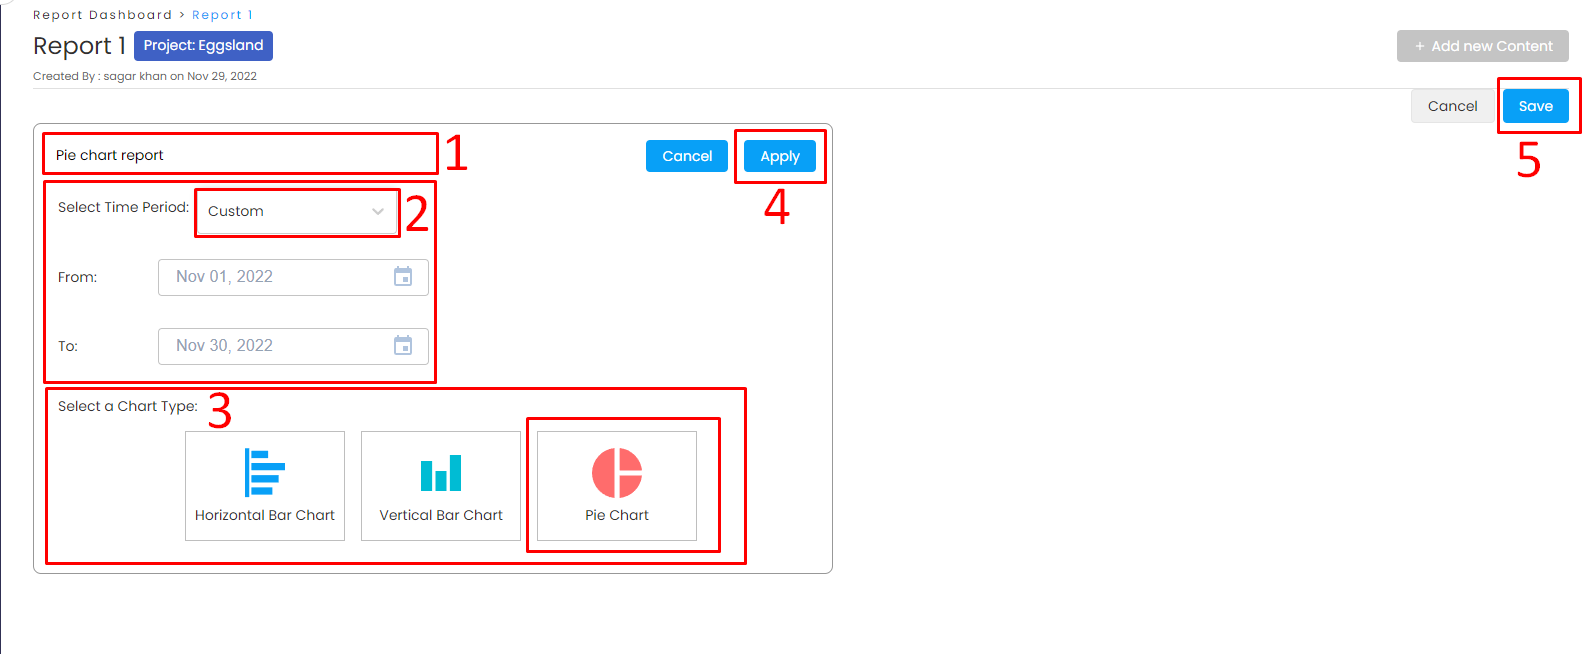
3\. Give the content a name (1)
4\. Select the time period. You can select daily, weekly, monthly, or customized (2)
5\. Select the chart type (3)
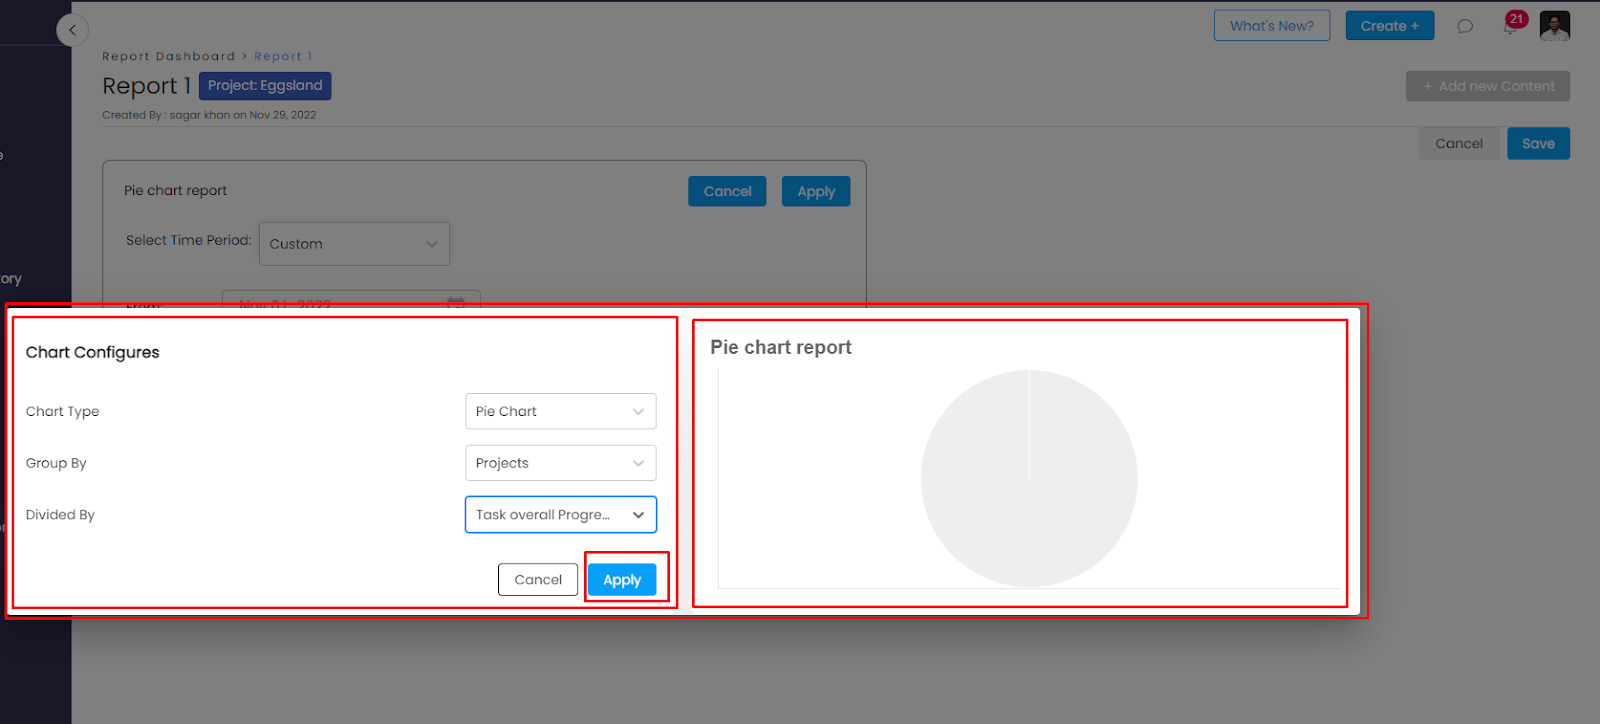
6\. In some formats, you may have to provide some necessary information to see a preview of that chart after choosing a chart type.
7\. Click Apply. Your customized report is ready. (4)
8\. Click the Save button at the right to save the report's contents. (5)
---
# Agent Instructions: Querying This Documentation
If you need additional information that is not directly available in this page, you can query the documentation dynamically by asking a question.
Perform an HTTP GET request on the current page URL with the `ask` query parameter:
```
GET https://docs.onethreadapp.com/4.-managing-company/4.6-report/4.6.3-add-contents-to-a-report.md?ask=
```
The question should be specific, self-contained, and written in natural language.
The response will contain a direct answer to the question and relevant excerpts and sources from the documentation.
Use this mechanism when the answer is not explicitly present in the current page, you need clarification or additional context, or you want to retrieve related documentation sections.